Stock market basic to advance prat-2
Bearish candle stick pattern

The Evening Star Pattern
Pattern Type: Bearish
The Evening Star candlestick pattern is a bearish reversal pattern that indicates a potential shift in the market's direction from bullish to bearish. Forming at the peak of an uptrend, the Evening Star suggests that the day is ending and night (or a bearish phase) is about to set in, metaphorically speaking.
What The Pattern Looks Like
The market psychology behind the Evening Star pattern can be dissected as follows:
Pattern psychology
The market psychology behind the Evening Star pattern can be dissected as follows:
What The Pattern Looks Like
The market psychology behind the Evening Star pattern can be dissected as follows:
- First Candle: This is a long bullish (green) candle continuing the prevailing uptrend. It has a long body, signifying a strong upward movement.
- Second Candle: The second candle can be either bullish (green) or bearish (red), but it is typically smaller in size or even a Doji (where the opening and closing prices are nearly the same). This candle will often gap up from the close of the first candle, implying it opens at a higher price than the closing price of the previous candle.
- Third Candle: This is a long bearish (red) candle that often gaps down from the close of the second candle. Ideally, it should close at least halfway into the body of the first candle. The deeper it penetrates into the first candle's body, the stronger the bearish reversal signal.
Pattern psychology
The market psychology behind the Evening Star pattern can be dissected as follows:
- Continuation of Bullish Sentiment: The first long green candle shows that bulls are still in control, pushing prices higher and continuing the existing uptrend.
- Market Indecision: The appearance of the second smaller candle or Doji highlights a slowdown in the bullish momentum. This represents a point of uncertainty in the market where neither bulls nor bears have a definitive grip.
- Change in Sentiment: By the third candle, the sentiment undergoes a clear shift. The price gaps down at the open, indicating that bears are now entering the scene with conviction. As this candle pushes downward, it solidifies the notion that bears have taken control, signaling the start of a potential downtrend.
- Seeking Confirmation: Although the Evening Star is a robust bearish reversal pattern, prudent traders often wait for additional confirmation. This could come in the form of another bearish candle following the Evening Star or through other technical indicators that might highlight growing bearish momentum.
What The Pattern Looks Like
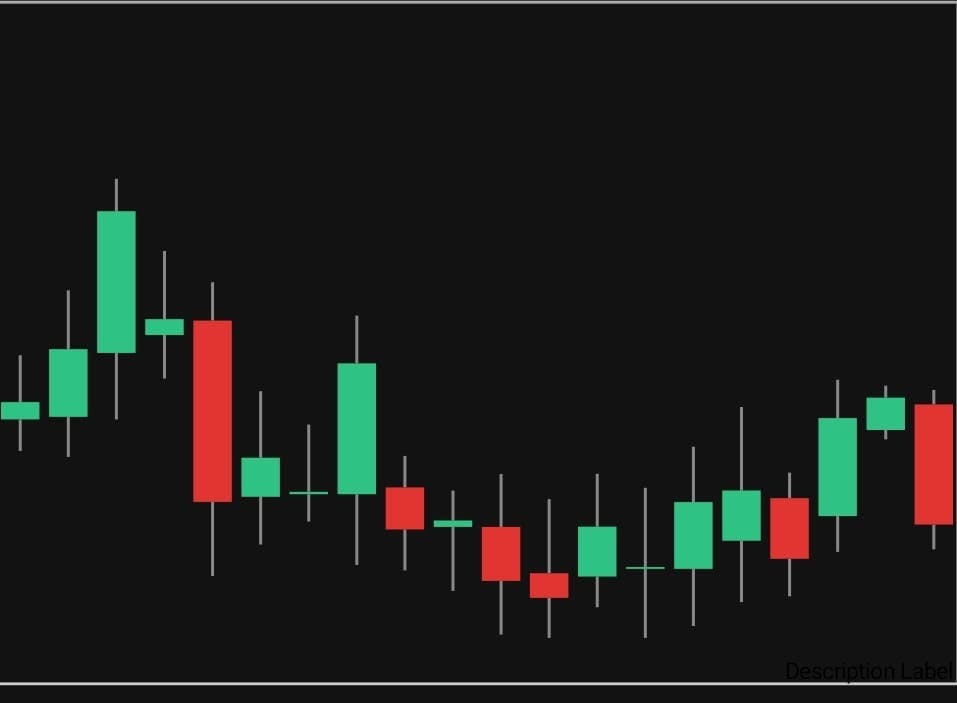
An Example Of The Pattern In A Graph
In summary, the Evening Star candlestick pattern serves as a valuable indicator for traders aiming to spot potential bearish reversals after a bullish trend. It vividly captures the tussle between bulls and bears and the eventual shift in dominance. As always, while the Evening Star is insightful, it's crucial to incorporate it with other technical analysis tools to make holistic and informed trading decisions.
The Three Black Crows Pattern
Pattern Type: Bearish
The Three Black Crows is a bearish reversal pattern that stands out as a clear signal of an impending downfall after a period of uptrend or bullish sentiment. As its name suggests, the pattern is symbolically likened to three crows descending upon a battlefield, symbolizing doom and darkness.
What The Pattern Looks Like
The Three Black Crows pattern consists of three distinct candles:
First Candle: This is a relatively long bearish (red) candle. It appears after a period of uptrend or bullish consolidation, indicating a sharp decrease in price from the opening to the close.
Second Candle: The second candle is also a bearish one, and it should ideally open within the body of the first candle. Crucially, this candle closes even lower than the first, further perpetuating the downward trend.
Third Candle: Following the trend, the third candle is bearish, opening within the body of the second candle. It should close lower than the second candle, affirming the bearish reversal trend.
For the pattern to be a genuine Three Black Crows formation, it's preferable for all three candles to have minimal or nonexistent upper wicks. This implies that the market consistently closed near its low during the formation of the pattern.
Pattern psychology
Diving into the psychology behind the Three Black Crows:
End of Bull Dominance: Before the emergence of the Three Black Crows, the market is generally in an uptrend or bullish consolidation phase. Bulls are dominant, driving prices upwards.
Bearish Onset: The surfacing of the first long bearish candle indicates an abrupt and potent selling interest. This could be attributed to negative news, shifts in market conditions, or other elements that reverse the prevailing sentiment.
Sustained Selling Pressure: The next two candles showcase a continued selling vigor. The consistent closing near the lows (with small upper wicks) reveals that bears maintain control throughout the trading days, overpowering any bullish attempts to elevate prices.
Shift in Market Mood: The sequential progression of the three candles highlights a decisive turn from a bullish or neutral sentiment to a pronounced bearish disposition. At this juncture, the market anticipates the downward trend to persist.
Prospect of Further Declines: While the Three Black Crows pattern is a formidable bearish signal, savvy traders often seek supplementary confirmation to ascertain the trend's strength. A continuation pattern or other bearish indicators in the wake of the Three Black Crows can bolster the prognosis of a sustained bearish period.
What The Pattern Looks Like
What The Pattern Looks Like

An Example Of The Pattern In A Graph
In conclusion, the Three Black Crows candlestick pattern offers traders a profound visual cue of a potential shift from bullish momentum to bearish dominance. Its strength is accentuated by its clear portrayal of the transformation in market sentiment. However, as a prudent practice, traders should couple this pattern with other analytical instruments to fortify their trading decisions.
The Hanging Man Pattern
Pattern Type: Bearish
The Hanging Man is a bearish candlestick pattern that often signals a potential top or resistance level in the market, particularly when it emerges after an uptrend. Its name, suggestive of its appearance, denotes the potential downfall or "hanging" of bullish sentiment.
What The Pattern Looks Like
The Hanging Man is defined by a single candle with these characteristics:
Small Upper Body: The body, whether bullish (green/white) or bearish (red/black), should be located in the upper part of the candlestick. However, a bearish body is seen as a stronger signal.
Long Lower Shadow: The hallmark of the Hanging Man is its long lower shadow (wick), which should be at least twice the length of the body.
Little to No Upper Shadow: Ideally, the Hanging Man should not have an upper shadow, but if present, it should be very short.
Location: For it to be a valid Hanging Man pattern, it should appear after a noticeable uptrend or bullish movement.
Pattern psychology
Breaking down the psychological undertones of the Hanging Man:
Uptrend's Climax: The formation of the Hanging Man at the end of an uptrend suggests that the bullish rally might be nearing its pinnacle.
Initial Bullishness: The trading session commences with the bulls pushing the price upwards, continuing the prevailing uptrend.
Bears Intervene: As the session progresses, sellers step in, pulling the prices down significantly. This intense sell-off is manifested in the long lower shadow. However, the bulls manage to push the price back up, but not entirely to the session's high, hence the small body at the top.
Uncertainty and Reversal Indication: The appearance of the Hanging Man after an uptrend indicates a possible shift in momentum. The pattern reflects uncertainty in the market, as bulls fail to sustain higher prices, leading to a potential turning point in sentiment.
Confirmation Is Key: While the Hanging Man is a bearish signal, traders often look for additional confirmation before making decisions. This could be in the form of another bearish candle following the Hanging Man or other corroborating technical indicators.
What The Pattern Looks Like
An Example Of The Pattern In A Graph

In conclusion, the Hanging Man pattern offers traders a visual cue of potential market tops and the impending weakening of bullish momentum. Its distinctive appearance underscores the tussle between bulls and bears within a trading session, with bears hinting at a takeover. Nevertheless, as with all technical patterns, it's imperative to analyze the Hanging Man in conjunction with other signals and within its broader market context for nuanced and informed trading strategies.
The Shooting Star Pattern
Pattern Type: Bearish
The Shooting Star is a prominent bearish reversal candlestick pattern that often signals a potential top or resistance in the market, especially when it appears after an uptrend. Its evocative name alludes to the meteoric rise and rapid fall represented by the pattern, suggesting a possible change in market sentiment from bullish to bearish.
What The Pattern Looks Like
The Shooting Star is characterized by a single candlestick with these defining features:
Small Lower Body: The body of the candlestick, whether bullish (green/white) or bearish (red/black), is situated at the lower portion of the candle. However, a bearish body often strengthens the bearish signal of the pattern.
Long Upper Shadow: A distinguishing feature of the Shooting Star is its extended upper shadow (wick), which should be at least twice the length of the body.
Minimal to No Lower Shadow: The pattern typically has a very short lower shadow or none at all.
Location: To be considered a valid Shooting Star pattern, it must appear after a significant uptrend or bullish movement.
Pattern psychology
Understanding the psychological dynamics behind the Shooting Star:
Continuation of Bullish Momentum: The session starts with the continuation of the existing bullish trend, driving prices upwards. This initial surge is represented by the long upper shadow.
Bearish Intervention: At some point during the session, bears take control and start to push prices down, erasing most of the gains made by the bulls. By the end of the session, the price closes near its opening level, forming the small body at the lower part of the candle.
Sign of Potential Reversal: The Shooting Star indicates that, despite initial bullish momentum, selling pressure managed to dominate by the close of the session. This shift from bullish to bearish sentiment within a single trading period, especially after a sustained uptrend, signifies potential exhaustion among the bulls and hints at a bearish reversal.
Seeking Confirmation: While the Shooting Star is a bearish signal on its own, many traders await further confirmation before making trading decisions. A subsequent bearish candle or other bearish technical indicators can solidify the pattern's reversal implications.
What The Pattern Looks Like
An Example Of The Pattern In A Graph

To wrap up, the Shooting Star pattern provides traders with a clear visual representation of a potential shift in market sentiment. Its characteristic shape tells a story of bullish ambition followed by decisive bearish intervention, signaling that a market top might be in place. As always, however, it's essential to interpret the Shooting Star within the broader context and in conjunction with other technical indicators for a more holistic understanding of the market's direction.
The Gravestone Doji Pattern
Pattern Type: Primarily Bearish (but context matters)
The Gravestone Doji is an intriguing candlestick pattern often signaling a potential bearish reversal, especially when observed after an uptrend. The pattern derives its ominous name due to its resemblance to a gravestone, representing the end of the bullish sentiment.
What The Pattern Looks Like
The Gravestone Doji is characterized by a single candle with the following traits:
Open, Close, and Low Prices: These prices are almost identical or very close, resulting in an extremely small or nonexistent body. Essentially, the open and close are at the lowest price point of the session or close to it.
Upper Shadow: The Gravestone Doji exhibits a long upper shadow (wick) that stretches above the body, signifying the range between the session's highest traded price and the opening/closing price.
Lower Shadow: This pattern either lacks a lower shadow or has a very short one, denoting that the lowest price of the day is around where the security opened and closed.
Pattern psychology
Delving into the psychological underpinnings of the Gravestone Doji:
Initial Bullish Momentum: The session starts with bulls pushing the price upwards, reflected in the long upper shadow as the price surges to its peak for the day.
Bears Take Control: As trading progresses, bears intervene and drag prices downwards. This bearish push is so pronounced that the session's close is at or near its opening price.
Indication of Reversal: The formation of the Gravestone Doji suggests that while bulls initially dominated the trading session, by its end, the bears managed to completely offset the bullish advance. Especially when appearing after an uptrend, this balance and eventual overpowering of bulls by bears points to a potential bearish turnaround or a deceleration of bullish momentum.
Importance of Context: While the Gravestone Doji is primarily interpreted as a bearish signal, its relevance and strength as an indicator are amplified when viewed within a broader trend. For example, its appearance following a protracted uptrend carries a strong bearish reversal implication. On the other hand, its occurrence during a downtrend might suggest potential deceleration in the bearish sentiment, but it doesn't serve as a robust bullish indicator.
What The Pattern Looks Like
An Example Of The Pattern In A Graph

To summarize, the Gravestone Doji provides traders with a visually compelling representation of a potential shift in market sentiment, typically from bullish to bearish. The pattern illustrates a session-long tug-of-war between bulls and bears, culminating in a bearish stand by the close. However, like all candlestick patterns, it's crucial to interpret the Gravestone Doji in tandem with other technical indicators and within its larger market context for more accurate trading decisions.
Next lesson is coming soon.
Any problem and query to connect me telegram - @atanu021